Lean Six Sigma - Quick Study by Gygi Craig;
Author:Gygi, Craig;
Language: eng
Format: epub
Publisher: BarCharts, Inc.
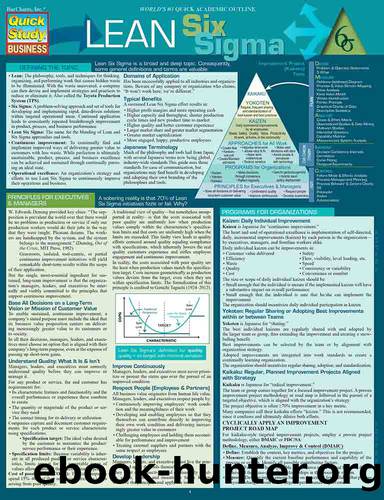
BOX-AND-WHISKER PLOT
Use to compare distributions of two or more instances of the same characteristic. Look for overlaps or gaps between distributions and differences or similarities in:
The range or spread of the distributions
The shape or symmetry of the distributions
The central locations of the distributions
To create a box-and-whisker plot:
Sort the data points from least to greatest.
Calculate the median, first quartile (Q1), and third quartile (Q3) for the data. The median is the data value corresponding to halfway through the sorted data. Excel: =MEDIAN(array) or =QUARTILE(array,2)
Download
This site does not store any files on its server. We only index and link to content provided by other sites. Please contact the content providers to delete copyright contents if any and email us, we'll remove relevant links or contents immediately.
| Agile | Lean |
| Quality Control | Six Sigma |
| Total Quality Management |
Hit Refresh by Satya Nadella(8854)
The Compound Effect by Darren Hardy(8508)
Change Your Questions, Change Your Life by Marilee Adams(7371)
Nudge - Improving Decisions about Health, Wealth, and Happiness by Thaler Sunstein(7241)
The Black Swan by Nassim Nicholas Taleb(6762)
Deep Work by Cal Newport(6563)
Daring Greatly by Brene Brown(6222)
Rich Dad Poor Dad by Robert T. Kiyosaki(6174)
Principles: Life and Work by Ray Dalio(5957)
Man-made Catastrophes and Risk Information Concealment by Dmitry Chernov & Didier Sornette(5646)
Playing to Win_ How Strategy Really Works by A.G. Lafley & Roger L. Martin(5493)
Digital Minimalism by Cal Newport;(5389)
Big Magic: Creative Living Beyond Fear by Elizabeth Gilbert(5351)
The Myth of the Strong Leader by Archie Brown(5237)
The Slight Edge by Jeff Olson(5199)
Discipline Equals Freedom by Jocko Willink(5156)
The Motivation Myth by Jeff Haden(5001)
Stone's Rules by Roger Stone(4854)
The Laws of Human Nature by Robert Greene(4770)
